
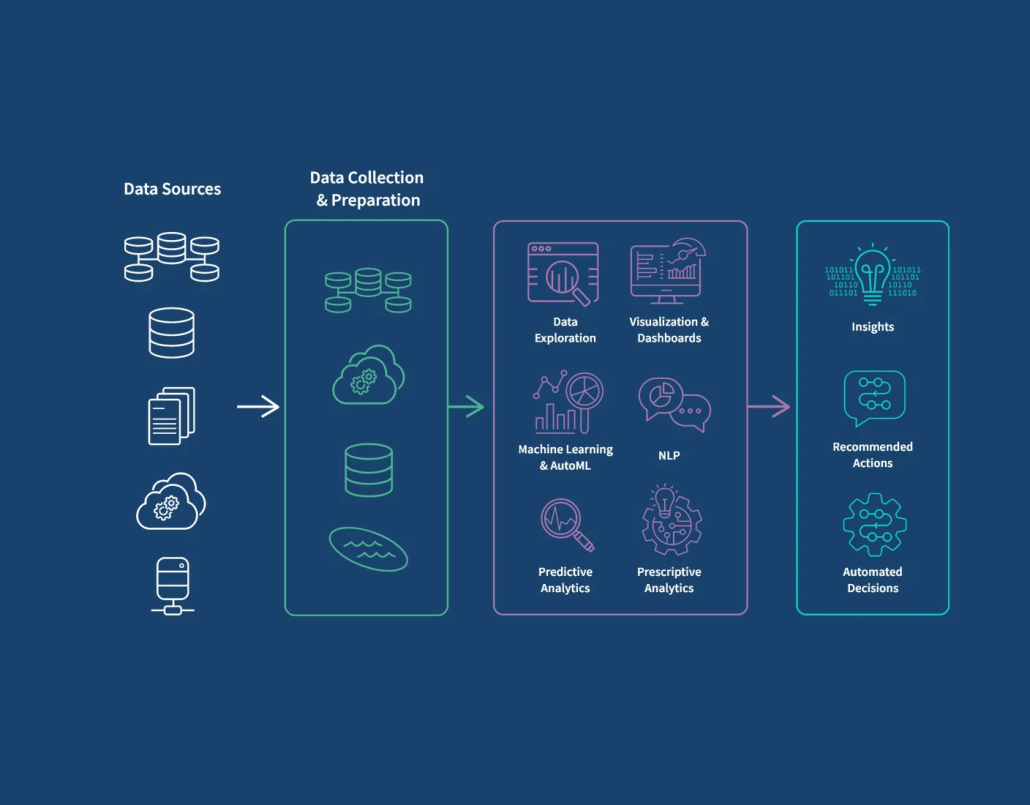
This diagram shows a clear, end-to-end view of how
AI analytics turns raw data into real business
decisions.
It starts on the left with data sources—databases,
documents, cloud systems, and applications. This
represents the reality of most businesses: data is
scattered across many tools and formats. On its own,
this data has limited value.
The next stage is data collection and preparation.
Here, information is gathered, cleaned, structured, and
stored in a way that makes analysis possible. This step
is critical, because AI can only be effective if the
underlying data is reliable and well-prepared. Think of
it as laying a solid foundation before building
anything intelligent on top.
In the middle, the diagram shows the AI analytics
core. This is where data becomes understanding.
Techniques like data exploration, dashboards, machine
learning, natural language processing, and predictive
analytics are used to uncover patterns, trends, and
signals that are hard to see manually. Instead of just
reporting what happened, AI starts answering deeper
questions like why it happened and what is likely to
happen next.
On the right side, everything comes together as
insights, recommended actions, and automated
decisions. This is the most important part from a
business perspective. The goal is not charts or models,
but outcomes—clear insights that people can act on,
suggestions that improve decisions, and automation
that reduces manual effort. At this stage, AI moves
from analysis to impact.
Overall, the image illustrates a simple but powerful
idea: AI analytics is a pipeline, not a single tool. When
data flows correctly through these stages, businesses
can move from information overload to clarity, from
guessing to knowing, and from reactive decisions to
proactive ones.